
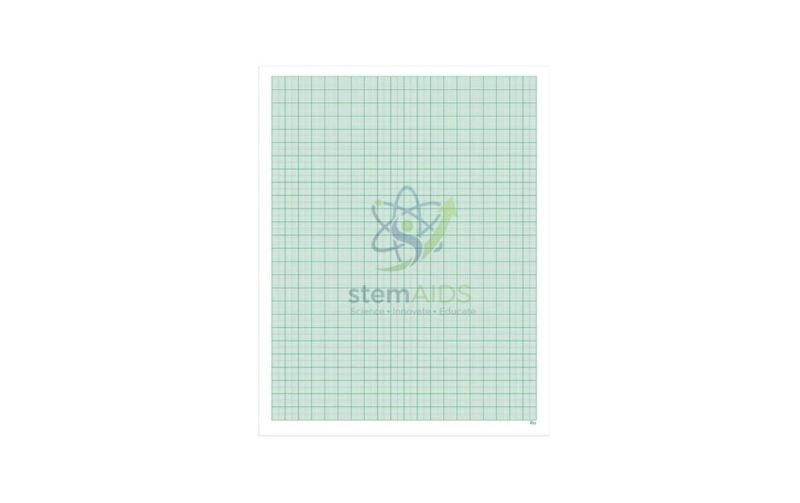
Quick Answer: Graph Paper is paper printed with a fine grid of evenly spaced lines, used for plotting measurements accurately by hand. In physics practicals graph paper turns a table of readings into a graph from which gradients, intercepts and relationships between quantities are read.
Plotting Results in a Physics Practical
The independent variable, the one the student changes, normally goes on the horizontal axis and the dependent variable on the vertical axis. Each axis is labelled with the quantity and its unit. Scales should spread the points over at least half of the sheet in each direction and use easy steps, such as 1, 2 or 5 units per large square; awkward steps like 3 per square make plotting and reading slow and error-prone.
Points are marked with small, neat crosses, and a single straight line or smooth curve is drawn to follow the trend, with roughly as many points above it as below. Joining the points dot to dot is not done, because the scatter of individual points reflects measurement uncertainty rather than the true relationship.
Reading the Gradient and Intercept
For a straight-line graph, the gradient is found from a large triangle drawn under the line, covering at least half its length, with the coordinates read from the line itself rather than from data points. The gradient carries units, and it often is the result of the experiment: the spring constant from a Hooke’s law apparatus, a resistance from voltage and current readings, or the acceleration due to gravity from a pendulum. The intercept on the vertical axis may reveal a systematic error, such as a zero error on an instrument.
Turning Curves Into Straight Lines
Many physical relationships are not linear at first sight. Plotting the square of a pendulum’s period against its length, or pressure against the reciprocal of volume for a gas, produces a straight line whose gradient can be measured. This technique, called linearising, is one of the main reasons physics students need plenty of good graph paper.
Uses
- Practical record books and laboratory reports
- Calibration graphs, for example of a thermometer or a spring
- Practice for practical examinations that require hand-drawn graphs
- Coordinate geometry and statistics work in maths classes
Specifications
| Type | Ruled grid paper for hand plotting |
| Grid | Evenly spaced fine lines, usually with heavier lines at regular intervals |
| Main use | Graphs of experimental results in practical work |
| Users | School and college physics, chemistry and maths students |
| Grid ruling, sheet size and pack quantity | Confirm at enquiry |
Care & Handling
- Store graph paper flat in a dry cupboard, since damp makes sheets curl and the grid distort.
- Plot with a sharp pencil so points and lines can be corrected cleanly.
- Avoid folding sheets through the plotting area; creases make the grid hard to read.
- Keep packs away from direct sunlight, which can yellow the paper over time.
Why Choose LabEquip
Schools, colleges and coaching centres buy graph paper in quantity for practical files and examination preparation. LabEquip supplies it alongside its physics lab equipment, and a hardwood metre rule is useful for drawing long straight lines across a sheet. Ask about bulk quantities through the contact page.
Frequently Asked Questions
How do I choose a good scale for a graph?
Make the points fill at least half of the sheet in each direction and use simple steps such as 1, 2 or 5 units per large square. Simple steps make plotting and reading quick and accurate.
Should the line pass through every point?
No. Draw one straight line or smooth curve that follows the overall trend, with points scattered evenly on both sides. Clearly anomalous points can be circled and left out of the line.
Why plot in pencil rather than pen?
Pencil points and lines can be corrected without spoiling the sheet, and a sharp pencil gives fine, precise marks that keep the plotting accurate.
How large should the gradient triangle be?
As large as practical, covering at least half the length of the line. A large triangle reduces the effect of small reading errors on the gradient.
What does linearising a graph mean?
It means choosing what to plot so that the expected relationship gives a straight line, for example period squared against length for a pendulum. The gradient of that line then gives the quantity sought.
Does the origin always have to appear on the graph?
No. If the readings are far from zero, a false origin lets the points fill the sheet. The axes must then be clearly marked, and any intercept must be calculated rather than read off.
Last Updated: October 2026




Reviews
There are no reviews yet.