
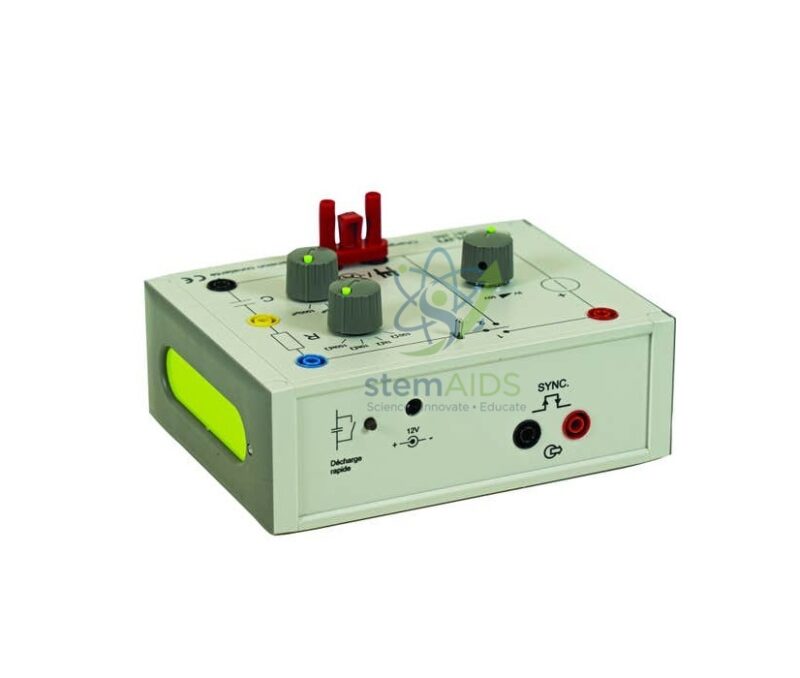
Quick Answer: Charging a Capacitor at Constant Voltage is a circuit module for the classic RC experiment: a capacitor is charged from a steady voltage through a resistor, and the voltage across it is recorded as it rises exponentially towards the supply value. Charging a capacitor this way lets students measure the time constant τ = RC.
The Exponential Charging Curve
When the switch closes, the capacitor in the charging module is empty, so the whole supply voltage E sits across the resistor and the current starts at its largest value, E/R. As charge builds up, the capacitor voltage rises and the voltage left across the resistor shrinks, so the current falls. The result is u = E(1 − e^(−t/RC)) for the capacitor voltage and i = (E/R)e^(−t/RC) for the current.
After one time constant the capacitor has reached about 63 percent of the supply voltage; after five it is within one percent, which is why five time constants is the usual working definition of fully charged.
Taking the Readings
The module shown in the product photograph is a compact box with terminal sockets, controls and a push-button on its top panel, ready to be connected to a DC supply and a measuring instrument. With a slow combination of resistor and capacitor, a voltmeter and stopwatch are enough; for faster curves a data logger or oscilloscope captures the whole rise in one sweep.
Plotting the natural logarithm of (E − u) against time gives a straight line with gradient −1/RC, a neat way to turn a curve into a single measured value that students can compare with the R and C they expect.
Where the Energy Goes
A charged capacitor stores ½CE². The supply, however, delivers CE² during charging, twice as much. The other half is turned into heat in the resistor, and the split is exactly half and half whatever the resistance, a result that surprises most students the first time they calculate it.
Specifications
| Experiment | Charging a capacitor through a resistor from a constant voltage |
| Quantity measured | Capacitor voltage, or current, against time |
| Panel | Terminal sockets, controls and push-button |
| Results | Exponential curve and time constant τ = RC |
| Component values and supply required | Confirm at enquiry |
Applications
- Recording the voltage-time curve during charging and finding τ from the 63 percent point
- Linearising the curve with a logarithmic plot
- Comparing measured time constants with values calculated from R and C
- Discussing stored energy and the energy dissipated in the resistor
Care & Handling
- Discharge the capacitor before handling the module or changing connections
- Keep the supply within the voltage marked on the module and observe polarity markings
- Switch off the supply when the module is not in use
- Store the module dry and away from heat sources
Why Choose LabEquip
Advanced-level physics and first-year college courses need an RC charging experiment that works first time, and a ready-made module saves building fragile circuits. LabEquip supplies it with the parallel-plate capacitor and other physics equipment; the contact page is the route for class-set requests.
Frequently Asked Questions
What is the time constant and how is it read from the graph?
The time constant is the product of resistance and capacitance. On the charging curve it is the time at which the capacitor voltage reaches about 63 percent of the supply voltage. It can also be found from the gradient of a logarithmic plot.
Why does the charging current fall over time?
As charge collects, the capacitor voltage rises and opposes the supply, leaving less voltage across the resistor. Less voltage across the resistor means less current, so the current falls away exponentially.
How long does a capacitor take to charge fully?
In theory it never quite reaches the supply voltage. In practice it is treated as fully charged after five time constants, when it is within about one percent.
Where does the energy from the supply go during charging?
Half is stored in the capacitor and half is turned into heat in the resistor. The supply delivers C times E squared, and the capacitor keeps one half of that amount.
Can the module also show a capacitor discharging?
Discharging through the same resistor gives a voltage that falls as E times e to the power of minus t over RC. The time constant is the same as for charging, so the two curves can be compared directly.
Why use a data logger instead of a voltmeter?
When RC is short the curve is over in seconds, too fast to read by hand. When RC is very long, the voltmeter’s own resistance can start to discharge the capacitor, so a high-resistance logger input gives cleaner results.
Last Updated: October 2026




Reviews
There are no reviews yet.